Telling your story is second only to doing something worth telling!
You have spent your entire year working hard to accomplish great things, but now you need to be able to share that work with others. There is so much more to creating an annual report than you might think. Click the cover photo below to view the full annual reports I have created over the past two years at Weber State. I have also shared 10 tips and tricks I have compiled from researching and creating an annual report for a technology department.
Within the content of the report, you can also see my passion for data analysis, training and professional development.
After creating the 2017-2018 Student Affairs Technology report, I was asked to create the annual report for the entire Student Affairs Division of Weber State University (2017-2018). I’ve attached a copy of that below as well.
For the 2018 – 2019 Annual Report, I was able to get even more involved in the design process and finalized all of the content, design and interactive elements of the project.


Technology is an essential part of student success in higher education. However, technology departments are constantly forced to prove their worth because of the physical and financial resources they consume. It is more important than ever to write an annual report for your technology department. By writing an annual report, you can be proactive instead of reactive in showing how valuable your services are to the university and overall student success. Additionally, you can create a department history to show how you have evolved over time to better meet the needs of students and stay up to date.
If you’re asking yourself how you go about doing this, you’re in the right place. The tips and tricks below will walk you through the process of creating an annual report for your technology-related department in higher education. You’ll be able to figure out everything from what to include to what your report should look like and everything in-between.
Here are 10 tips and tricks to help you through this process.
1. Make a plan
2. Determine your audience
3. Decide what to include
4. Select a format
5. Use a Stylebook
6. Begin writing
7. Write for readability
8. Proofread your work
9. Use infographics
10. Plan for Next Year
Tip 1 – Make a Plan
A good annual report can take three to four months to complete. Requiring you to gather quotes, data, photos, interviews, and more. If you’re just now reading this and plan to create an annual report in the next month or two for your department, take a breath. It can be done, but it isn’t going to be easy.
This project will take a great deal of collaboration. If everyone else isn’t as invested as you are it will be a challenge to gather the information you need. The first thing you need to do is get “buy-in” from everyone in your department. You aren’t going to be able to do this without them. Sell them on why an annual report is so important to your area, then work with them to decide what data you collectively have for your department.
Create a list of data and who can access it, then set a deadline for when you need it by. A great way to do this is to create a shared cloud folder that everyone can save their information to. You likely won’t include every piece of data you have access to. However, it’s important to have it all available.
For more information on why you should write an annual report and how to plan for one, see:
https://www.formandfunctionagency.com/plan-annual-report-design/
Tip 2 – Determine Your Audience
Before you can decide what data to include, you need to determine who will be viewing your report. This is probably the most important part of writing your annual report. Your report needs to be written for your audience, not for yourself. Knowing your audience will shape what you include, what format you use, how you write, and more.
If the purpose of your report is to be proactive in proving how important your department is, think of who you need to share the information with. Once you’ve thought this through, write out a list that you can refer to as you’re working on your report. This will help you focus the content of your report.
Example
Your audience should mostly be the department’s key stakeholders. My department, Student Affairs Technology (SAT), provides services in almost every building on campus and is partially funded by student fees. Each area, or person that provides financial or physical support, should be receiving a copy of your report. You should also consider your annual report a way to show your accomplishments and work environment to prospective staff members and other institutions. My list includes:
- Vice President
- Deans
- Student Fees Committee
- Current and Future Staff
- Other Universities
For more information on the importance of determining your audience, see:
- https://www.skillsyouneed.com/write/know-your-audience.html
- https://www.wildapricot.com/articles/ar-who-is-your-audience
- https://www.thebalance.com/write-nonprofit-annual-report-2502336
Tip 3 – Decide what to include
At this point, you should have a list of the data you have access to and who your audience is. You can use this information to determine what to include in your report.
In technology fields, we often focus on numbers and facts. You are not the key audience for your report. You need to focus on what your audience wants to see. Given the scope of your stakeholders, it’s important to include information that supports each of the three areas of persuasion: ethical, emotional, and logical.
In deciding your content, you’ll focus on the emotional and logical means of persuasion, leaving ethical for your writing. You will not only include the numbers and facts that we’re all accustomed to, but you also need to show your impact through photos, quotes and other emotionally focused methods.
Some key things to consider:
Mission
Relate everything you can back to your mission. Your university may have many missions, visions, goals, and focuses. The important part is that you know what they are, how they apply to you, and that you use them to guide what you do. You need to make sure your stakeholders know that as well.
Participating in a volunteer day with your colleagues is great, but stakeholders want to know that it was worth the time you took to do that because you were supporting the overall mission of your institution.
You are supporting the mission of your university, even in technology. You don’t have to be teaching a class to support your mission. For my area, I have categorized our information into the core values of the university.
Example
Weber State Core Values:
- Learning through personalized experiences and shared inquiry
- Engagement in community
- Access and opportunity for all
- Respect for people and ideas
- Nurturing the potential within every individual
SAT Annual Report Table of Contents:
- Goals
- Department Goals
- Learning
- Learning opportunities, training, and conferences
- Engagement
- Community and campus engagement
- Access
- Access you provide to students.
- E.g. Computer lab usage data, laptop checkout data, scholarships, etc.
- Access you provide to students.
- Nurturing
- Activities that benefit student employee’s personal and professional development
- Operations
- Everything else: assessment, finances, projects, etc.
Numbers
Again, determine what is important to your audience. Ensure that each item of data you have access to is important to at least one of your stakeholders. If it isn’t important, remove it from your report.
Example
The SAT computer labs have 10 locations across campus. Each location is open to all students, but most are in a building that holds a specific college. It is important to show each dean why the lab is important to the success of their students. To do this, I created a page for each lab that shows:
- Unique lab users
- Number of times they have used the lab
- Total number of laptop checkouts
- Total pages printed
- A pie chart of majors using the lab
With this information, a dean can see that the computer lab is being used by their students. Showing them the importance of continuing to allocate space to SAT.
Department Culture
Current and future employees will want to know what your department values, what you do together, and what you invest time and money into. Show activities, events, conferences, and programs that benefit them, but more importantly, show why you do these things. Show the benefit to the individual and the university. You can do this through data, quotes, interviews, and photos.
Example
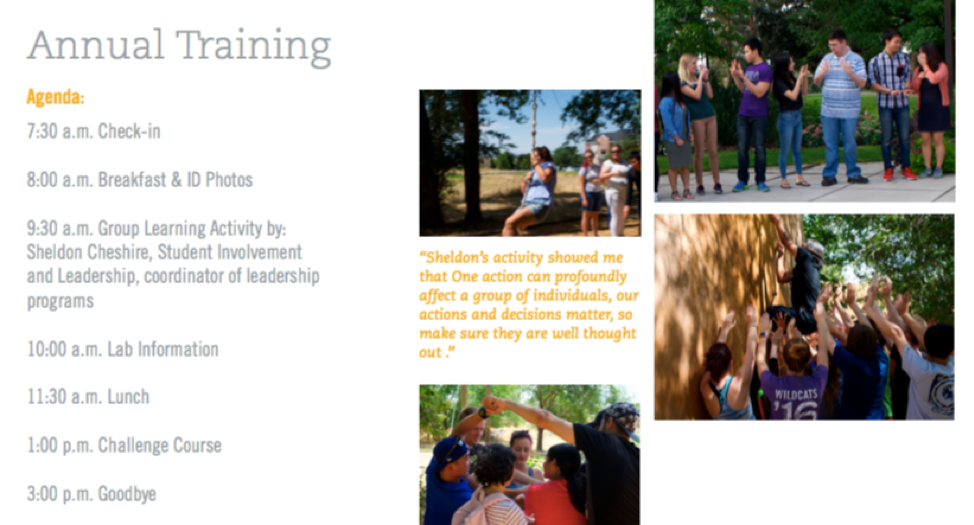
Instead of writing a page of information about the benefit of annual training, I was able to show it. I included a copy of the training agenda, photos, and a quote showing the impact of the activities.
For more information on what to include in your report, see:
- https://www.thebalance.com/write-nonprofit-annual-report-2502336
- http://blog.marketingv2.com/bid/259854/7-essential-elements-of-an-exciting-nonprofit-annual-report
- https://bizfluent.com/how-5526756-write-departmental-report.html
- https://classroom.synonym.com/write-annual-report-department-6390921.html
- http://pathosethoslogos.com/
Tip 4 – Select a Format
There are many format options for your report. It is important to keep your audience and your information in mind when selecting your format. Some common formats include a full-color book, handout, basic paper report, website, video or an interactive PDF. You also need to consider your budget and how you plan to get your report to your audience.
Given that we are working in technology, an interactive PDF is a great option to consider. It can be completed with no printing or delivery cost, it is easy to share and reference, and can be hosted on your department’s website.
Look at examples of what other people are doing. Don’t limit your search to other departments within your university or other universities. Look at corporate and non-profit annual reports. It is important to create something you’re proud of instead of just doing something average or expected.
For more information on selecting a format, see:
Tip 5 – Use a Stylebook
A stylebook is an important tool in establishing your credibility as a writer. The book includes a list of spelling, punctuation, and grammar rules. There are multiple stylebooks available. It is important that you select one guide and stick to it. This will create clarity, accuracy, and consistency throughout your report.
Before selecting a stylebook on your own, determine if your university has created their own style guide or a specific style that they follow. Weber State, for example, has their own style guide. This guide answers university-specific formatting questions such as professor titles and building names but is not inclusive enough to answer everything you need for your report. In this case, use the university style guide first, then the guide they recommend.
If your organization does not use a specific stylebook, check out the AP Stylebook. This is a commonly used and well-recognized style guide that will assist you to answer questions about usage such as, abbreviate street here, or does Presidents day have an apostrophe, or not?
For more information on the AP Stylebook, see:
- http://www.communiquepr.com/blog/?p=5283\
- http://www.axiapr.com/blog/what-is-ap-style-and-why-is-it-important-to-pr
Tip 6 – Begin Writing
You have the information you need to create a great annual report, now you need to begin writing. Start by creating an outline of all the information you have chosen to include, then begin filling it in. Review each item and take the time to get all the information you have about each topic written down. Include all the details of the project or information about your data, employee or user quotes, photos, interviews and any other information you have available. Don’t aim for perfection. Simply write down the information.
After you have everything written down, review and revise your document to make sure you’re writing for your audience and you have the information you need. Eliminate any content that wouldn’t benefit your audience. Then reference your style guide to make sure your report is written consistently.
For more information on writing your report, see:
- http://www.writing-skills.com/how-to-write-annual-reports
- https://www.slideshare.net/EricJacobsonAscend/how-to-write-an-effective-nonprofit-annual-report
Tip 7 – Write for Readability
Once you’ve written your outline and reviewed it for your audience, review it a third time for readability. Clean up your writing, making it clear and concise. An annual report should be written professionally but clearly.
Eliminate jargon, clichés and acronyms. Remove unnecessarily long words and excess adjectives. Higher education and technology are both filled with an enormous amount of jargon and acronyms. Including these in your report makes it harder to read and narrows your audience.
Writing in the active voice is another important way to increase your readability. To do this, the subject of the sentence is performing the action versus the passive voice where the subject is being acted upon.
To help check your document for readability and active voice, use the “Readability Test” in Microsoft Word. This isn’t a replacement for having other people proofread your report, but it’s a great place to start while you’re writing.
Example:
Passive with jargon: Ten Open-Student Computer labs, technical support to all of Student Affairs, python and JavaScript web development, desktop publishing, and server support for SA WEB, Click and Point, Blackboard, and Titanium are provided by Student Affairs Technology.
Active and concise: Student Affairs Technology provides 10 computer labs, Student Affairs technical support, web and graphic design services, and programming support.
For step-by-step instructions on how to turn on the Microsoft Word readability report, see:
For more information on writing for readability, see:
- https://writing.wisc.edu/Handbook/ClearConciseSentences.html
- http://www.clearlanguagegroup.com/readability/
Tip 8 – Proofread your Work
After reviewing your report to make sure it’s written clearly and concisely, you need to make sure you’re writing accurately. Accuracy is important to the ethical persuasion of your audience. When you make mistakes, you lose credibility and bring the quality of your work and your department into question.
Quality work not only makes you look good but also makes others try harder. By consistently producing quality work, you encourage those around you to do the same. Proofread your report multiple times and have others proofread for you. After seeing the report many times, you won’t catch your own mistakes. Having people within your department proofread for you is a great start but seek out advice from others who do not work in your department. They can make sure you aren’t using acronyms and jargon outsiders won’t understand.
For more information on proofreading, see:
- https://www.fatrabbitcreative.com/blog/the-importance-of-proofreading
- http://www.latimes.com/socal/daily-pilot/opinion/tn-hbi-et-1224-casagrande-20151224-story.html
Tip 9 – Use Infographics
People have increasingly less time to review information. Infographics solve that problem by displaying information in graphic form. Infographics give your reader a way to scan information and quickly gather important pieces while remaining engaged with your report. They also help you tell your story and continue the flow of your report even when you need to present some of the less engaging information and data you’ve decided to include.
Infographics are also easy to share. You can create them for your annual report and use them many other ways, like on your website or social media.
Look at the example below and think about what the information would look like if it were all text?
Example
This infographic is used to show the growth opportunities for student employees in the SAT computer labs.

Tip 10 – Plan for Next Year
Making a plan now for what you want to include in your report next year can eliminate unnecessary barriers and stresses in this process. Take photos of your events and organize them in a folder for your annual report. Gather the data, interviews, and quotes that go with each event while they’re happening and add them to the same folder. That way, when it’s time to write your report, you already have a lot of what you need.
You can also create processes that make it easier to collect the data you need. Be creative. Use Excel to create pivot tables for your department spending, look for new software that can collect usage statistics, create new surveys. Think throughout the year of ways you can represent what you do and why you do it in your annual report.
Conclusion
Annual reports are complex and time-consuming projects. They take a lot of thought and preparation, maybe even some blood, sweat and tears. Give yourself time to get the information you need to create something great. Have others double check and proofread your work, and most importantly, keep your audience in mind with each decision you make.
When an annual report is done correctly, it not only gives you something that you can be proud of, it gives you something you can share with others to showcase your department’s accomplishments.
Ask the Expert
Jessica Oyler, Ph.D., has written the annual report for the Student Affairs Division since she started at Weber State in 2008. She stated, “You need to show off a little bit and you need to share your report with all of your stakeholders.” Use your annual report to highlight your accomplishments, provide a history of your department, and post to your website and social media for current and prospective employees.
Oyler, Director of Student Affairs Strategic Initiatives and Assessment, noted that your report should only focus on highlights, writing everything you have done through the entire year is not the way to make an annual report. However, she stressed that having an annual report you’re proud of is the most important thing, stating, “that’s what you should focus on, and if that’s what you have in the end, you’ve done it right.”
